
Scalable Data Architecture Engineering for High-Impact Business Analytics
Case Study: Designing Scalable Data Architecture for Better Analytics
Efficient Data Management to Accelerate Analytical Decision-Making

This case study highlights a company aiming to implement a company-wide back-to-office initiative. To support decisions on desk capacity allocation, they sought to leverage analytics. However, with multiple disparate data sources, gaining a holistic view of the business was challenging. To address this, they partnered with Digital Fortythree to develop a scalable business solution.
Practice Area
Data Engineering & Infrastructure
Technology
Alteryx Designer, Tableau, SQL Server
Infrastructure
On-premise
Impact
Empower analytical decision-making through accessible data
Data Architecture for better Data Management
To approach this problem, Digital Fortythree outlined an efficient data architecture to support the company’s goal for unified analytics. The illustration below overviews the approach and can be segmented into three main operations. This is comprised of a staging layer, curated layer, and extract layer. Each layer has a distinct function and is discussed below. The architecture is designed to empower analysts and business intelligence engineers by providing a reliable framework of high-quality data that is easily accessible and ready for actionable reporting.
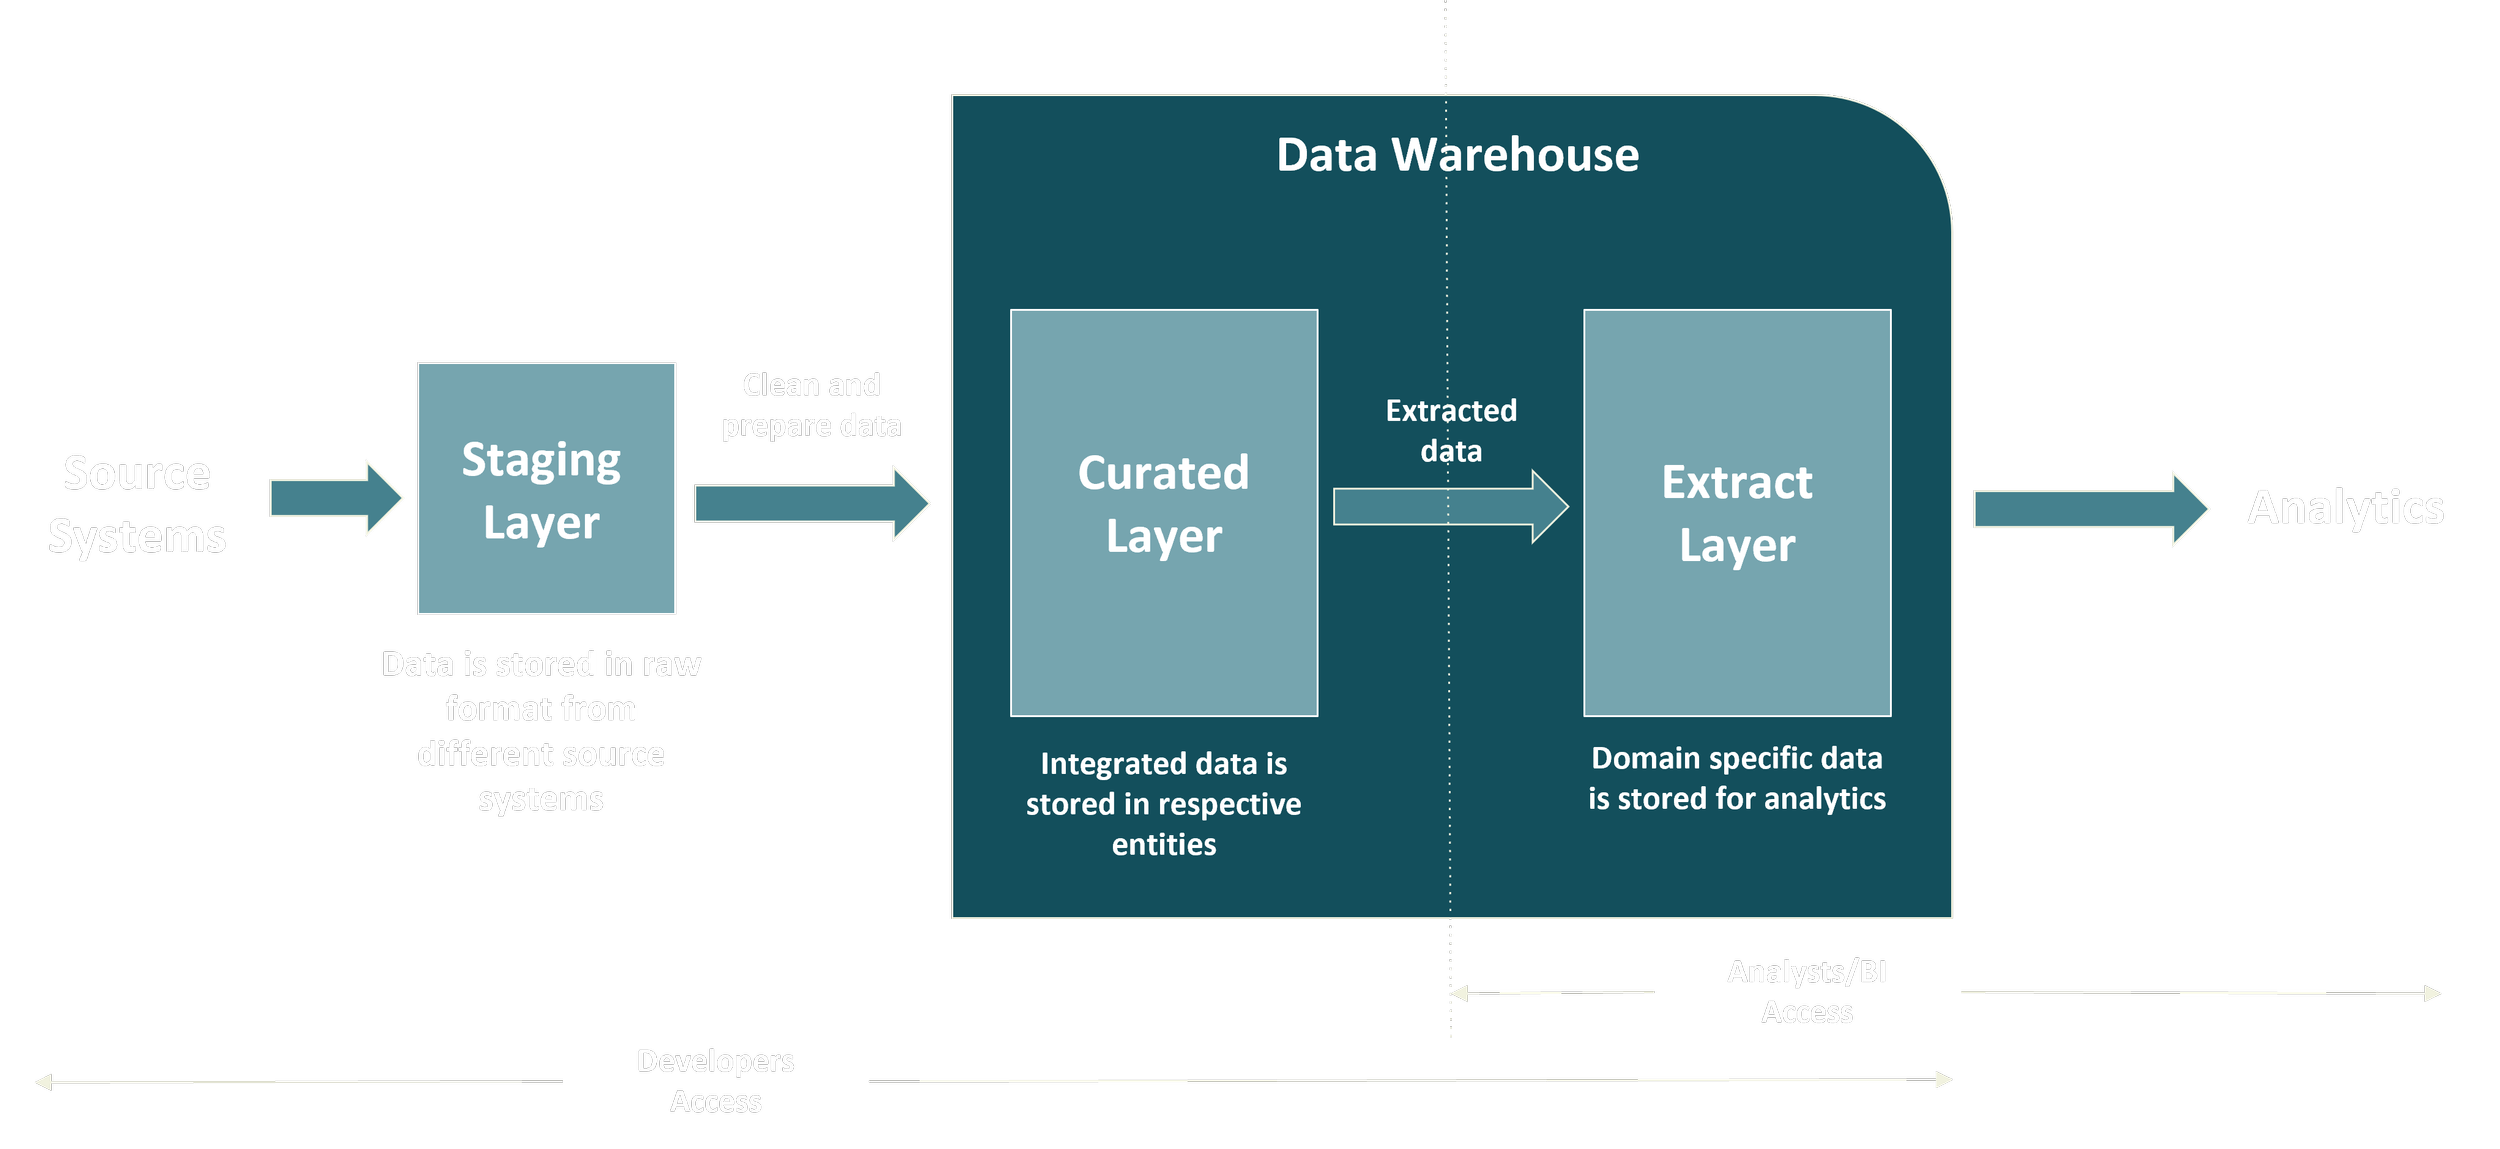
Data Management architecture segmented into three layers. This process ingests source systems for ETL activities, then to be curated. The last operation stores the data for analytical consumption.
Stagging Layer

A temporary storage area where raw data is first landed or ingested from various source systems before any processing, transformation, or integration happens.
Staging data imports can be stored as raw files or of any structure in its raw format from source systems.
Text files
Excel files
Databases
In our use case, the staging layer data is stored in Excel files that consolidate disparate information from multiple departments, including:
Security: Badge swipes and credential records
Facilities: Desk assignments and location details
Corporate: Company hierarchy and credential information
Management: Departmental needs and current resource allocation
Curated Layer
The base layer for storing data in a structured format after integrating data from different source systems to manage data efficiently and accurately.

The data from the staging layer is cleaned, transformed, and integrated
For each of the tables, an Alteryx workflow is created to load the data
We leveraged Alteryx Designer for its intuitive, no-code platform to streamline the ETL (extract, transform, load) process. The workflows shown here illustrate how our engineers efficiently parse and blend data, using specialized tools represented by the green and purple icons. Additionally, Alteryx’s ability to add notes and descriptions directly on the canvas enhances communication and documentation of the process, ensuring transparency and ease of collaboration.
Extract Layer
Data is extracted from the Curated layer to form domain-specific data, which analysts use to build dashboards.

In our use case, domain-specific data is organized by each department’s resources within an access-controlled analytical layer—essentially a user-friendly front door for analysts. They receive precise metrics, such as desk utilization, upon granted access, requiring no engineering effort on their part. At the same time, data lineage and schema are clearly maintained to support reliable data modeling.
The data warehouse embeds data types and descriptions to enhance discoverability downstream.
Schema, lineage, and format information travel with the data as it becomes available.
This metadata guides analysts in understanding and effectively using the data.
Front-end engineers use this consistent information to visualize data and create reports aligned with the source system’s terminology.
SQL Server
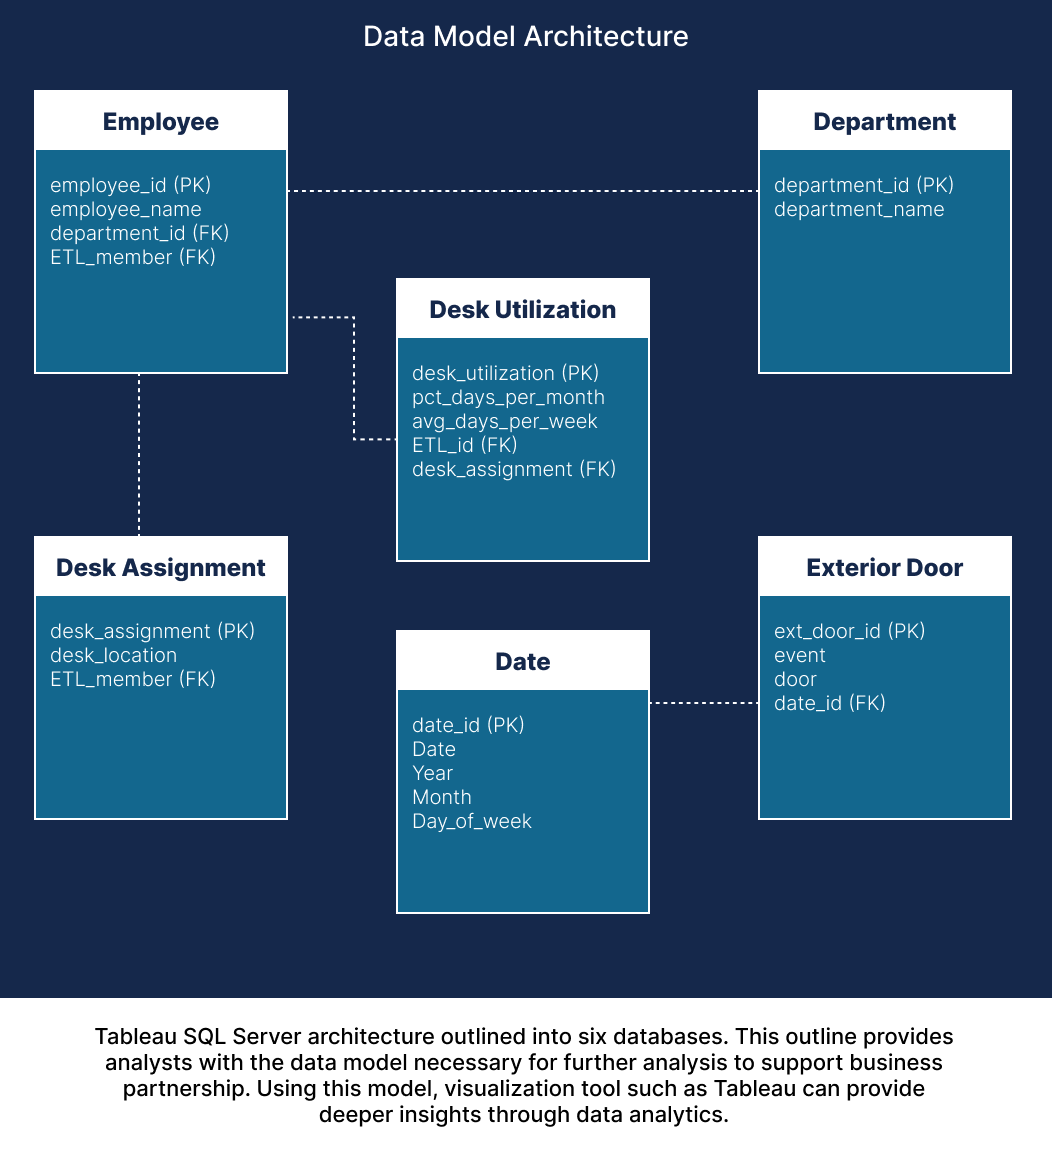
The SQL Server data model serves as the foundational layer that underpins the company’s reporting and analytics capabilities. It organizes and integrates data from multiple departmental sources into a coherent, accessible structure tailored for Business Intelligence (BI) consumption.
Designed with clear relationships and well-defined keys, the model ensures data integrity and consistency across business domains such as Employee, Department, Desk Assignment, Desk Utilization, Exterior Door, and Date. This structured approach supports efficient querying and reliable metric calculations.
Data visualization engineers leverage this robust model using tools like Tableau to create dynamic dashboards and executive reports. Tableau connects directly to the SQL Server, enabling interactive analysis and real-time exploration of key metrics such as desk utilization and resource allocation. This empowers business leaders with timely insights that drive informed decisions and improved operational planning.
Conclusion
By adopting this approach to data management, your organization gains:
Clean, reliable data that ensures a single source of truth
Strong data governance with secure, controlled access
Full transparency with traceable data lineage end to end
Faster, smarter decisions powered by discoverable, domain-specific data
Flexibility and scalability to evolve without disrupting your processes
Ready to transform your data into a strategic asset? Let’s connect and explore how we can help you unlock actionable insights and drive business growth.